
Standard Deviation Calculator
Standard deviation measures how spread out numbers are around their mean — small when values cluster together, large when they vary widely. Paste your data to get both the sample and population versions, with every step of the calculation laid out so you can check homework or explain results, plus z-scores and a histogram.
- Free to use
- No sign-up
- Runs in your browser
Standard deviation calculator
Standard Deviation Template Pack
Excel standard deviation workbook with a step table, printable step-by-step worksheets with answer keys, a full z-table, a formula card and a data collection sheet.
- SD workbook (XLSX)
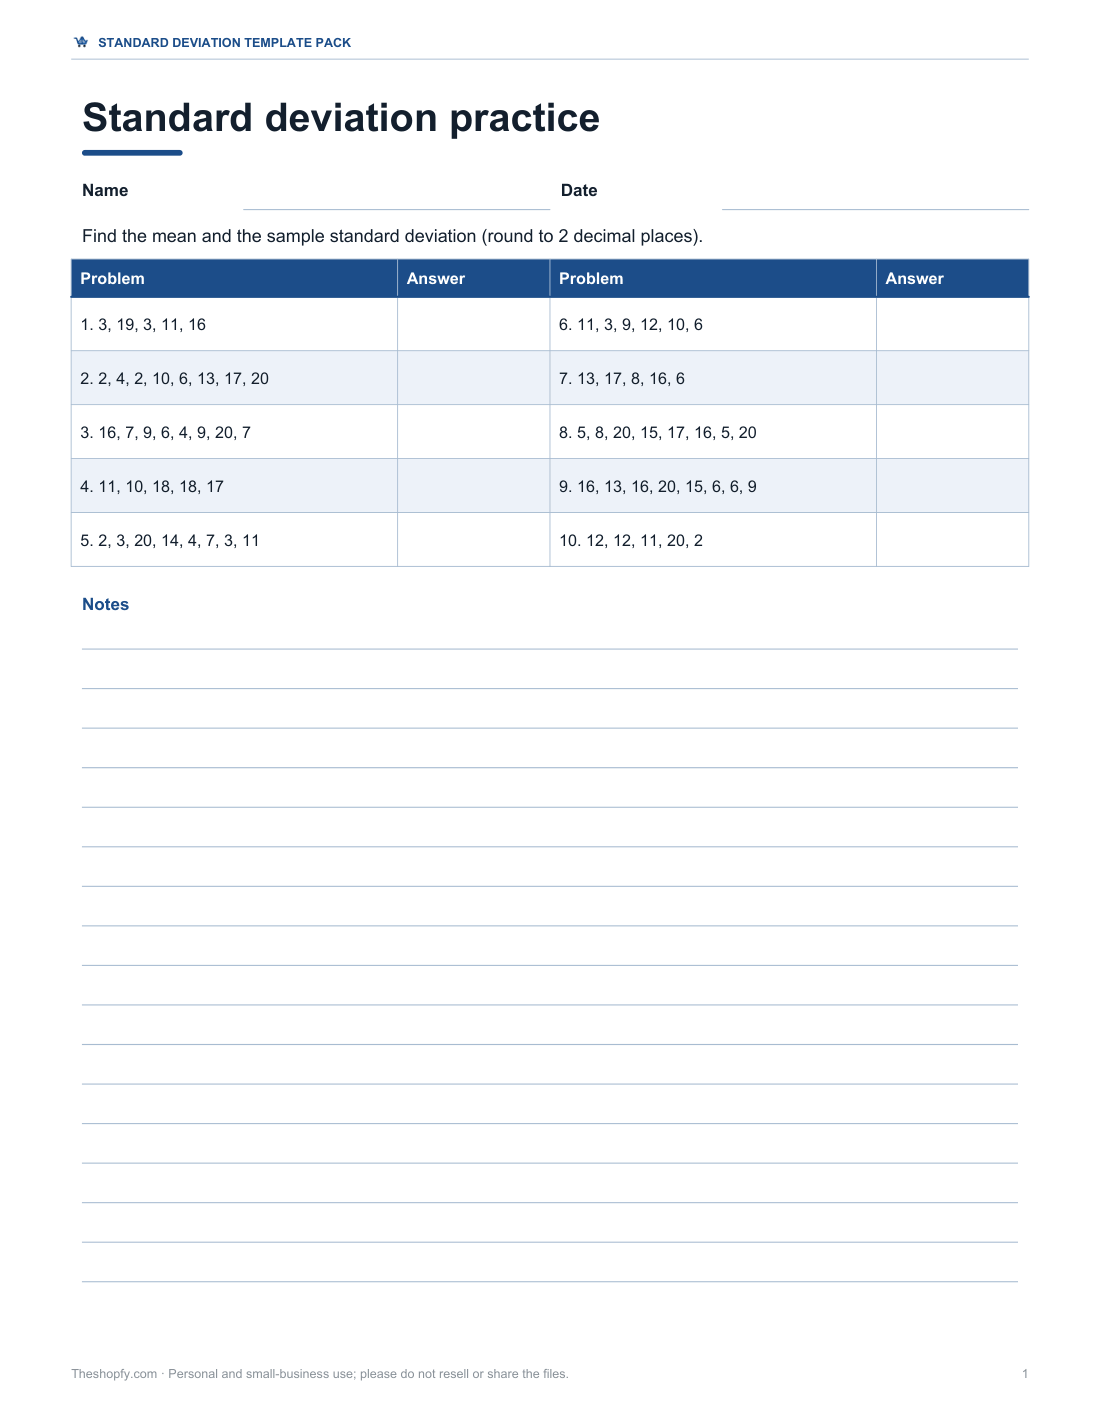
- Step-by-step worksheet (PDF/DOCX)
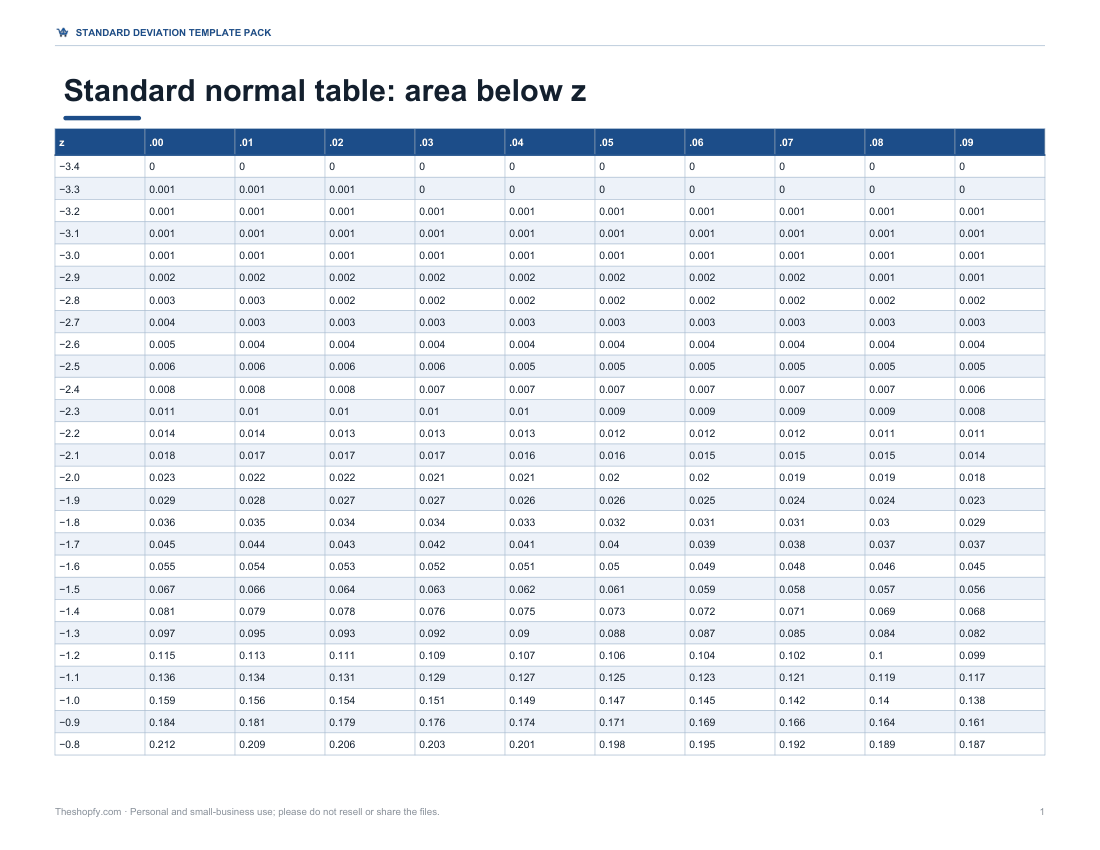
- z-table (PDF/XLSX)
- Formula card (PDF)
- Data sheet (PDF/DOCX/XLSX)
Formats: XLSX, PDF, DOCX. Instant download after payment (link valid 72 hours, up to 5 downloads). AI-assisted: the templates were drafted with AI help and reviewed and laid out before publishing.
$5.00 USD, one-time 5 files · about $1.00 each
- Instant download
- 7-day refund
- Secure checkout by Stripe
✓ Classroom use included
7-day money-back guarantee. Full refund within 7 days of purchase, even after you download.
Free sample: Standard Deviation Workbook (PDF, 97 KB)
Full refund within 7 days — see the refund policy and license.
License: personal and classroom use. Teachers may print and photocopy these files for the students in their own classes, and share them in a password-protected class space (e.g. Google Classroom). Please do not resell, redistribute, or post the files on public websites. One purchase covers one teacher.
Free printables
Single sheets you can print right now, no sign-up. The full pack adds every sheet in one download plus the editable files.
 Standard Deviation Workbook
 Printable Standard Deviation Worksheet
 Printable Z Table Chart
 Printable Standard Deviation Formula Card
 Printable Data Collection Sheet
The formulas
| Quantity | Population | Sample |
|---|---|---|
| Mean | μ = Σx ÷ N | x̄ = Σx ÷ n |
| Variance | σ² = Σ(x − μ)² ÷ N | s² = Σ(x − x̄)² ÷ (n − 1) |
| Standard deviation | σ = √σ² | s = √s² |
| Standard error of the mean | — | s ÷ √n |
| z-score | z = (x − μ) ÷ σ | z = (x − x̄) ÷ s |
Use the population formula when your data includes every member of the group you care about — all 30 students in one class, for example. Use the sample formula when your data is a sample used to estimate a larger population. Dividing by n − 1 (Bessel’s correction) makes the sample variance an unbiased estimate of the population variance.
Worked example step by step
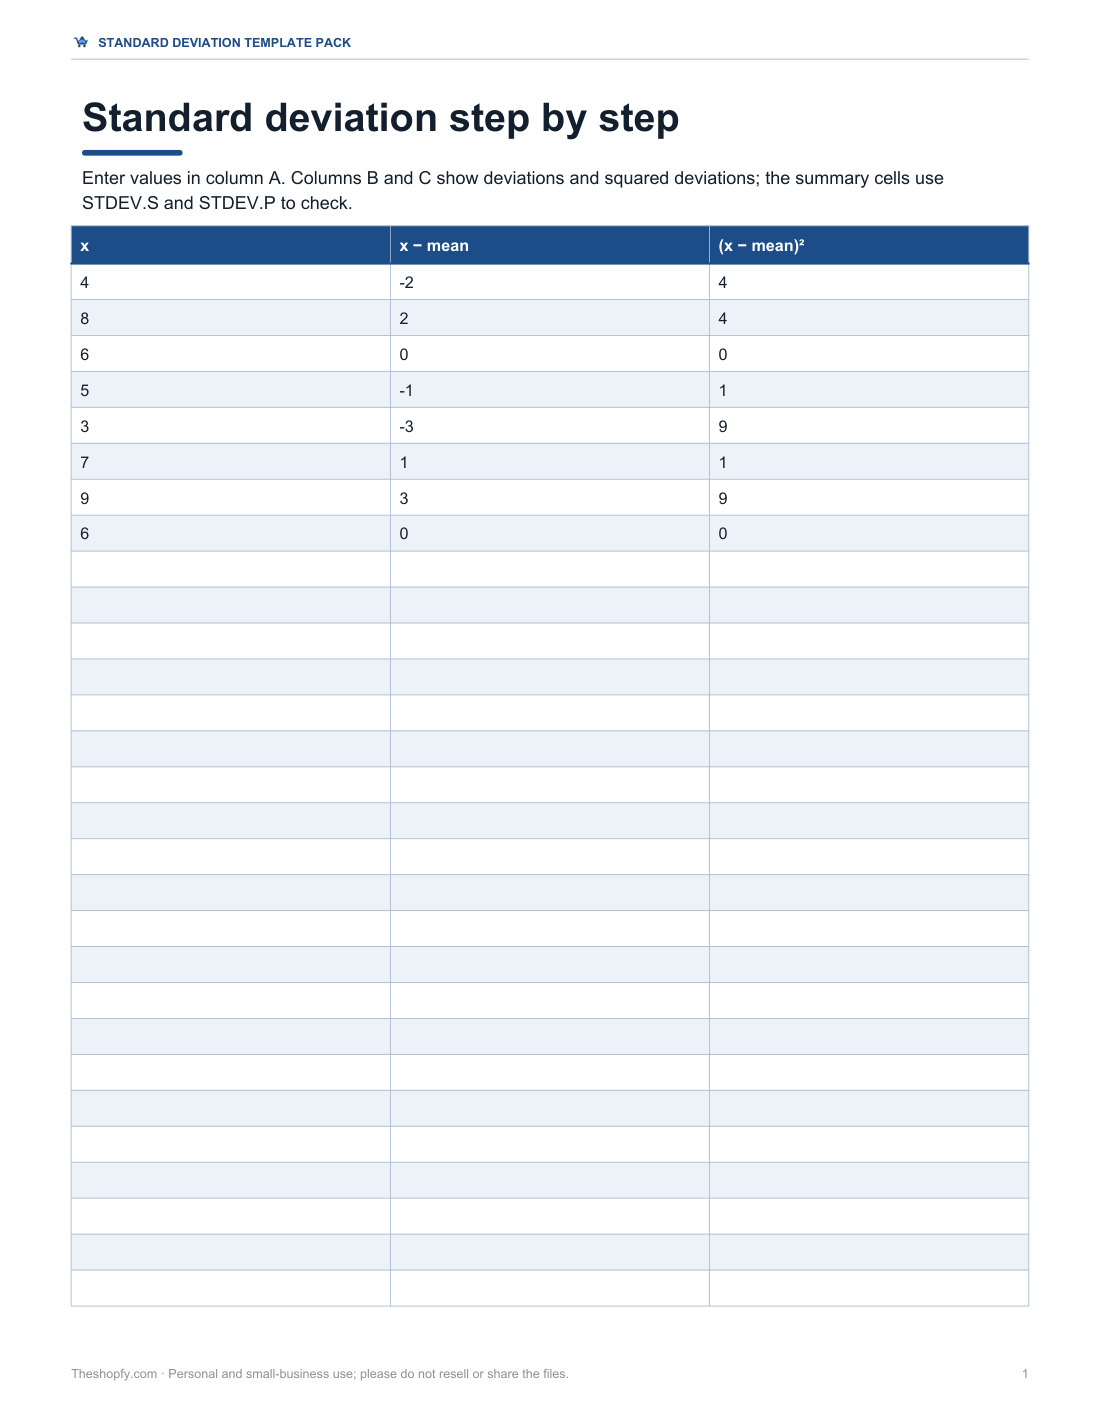
| x | x − mean | (x − mean)² |
|---|---|---|
| 4 | -2 | 4.0000 |
| 8 | 2 | 4.0000 |
| 6 | 0 | 0.0000 |
| 5 | -1 | 1.0000 |
| 3 | -3 | 9.0000 |
| 7 | 1 | 1.0000 |
| 9 | 3 | 9.0000 |
| 6 | 0 | 0.0000 |
| Sum | 0 | 28.0000 |
For the data 4, 8, 6, 5, 3, 7, 9, 6: n = 8, the sum is 48 and the mean is 6. The squared deviations add up to 28.0000. Sample variance s² = 28.0000 ÷ 7 = 4.0000, so s = 2.0000. Population variance σ² = 28.0000 ÷ 8 = 3.5000, so σ = 1.8708. These are the default numbers in the calculator above.
Interpreting standard deviation
- SD is in the same units as the data: test scores with SD 8 points, heights with SD 7 cm.
- Compare spread between groups with similar means; for different means, use the coefficient of variation (SD ÷ mean).
- For roughly normal data, about 68% of values lie within 1 SD of the mean, 95% within 2 SD and 99.7% within 3 SD (the empirical rule).
- Outliers inflate SD strongly because deviations are squared — check the histogram.
- An SD of 0 means every value is the same.
Standard normal table (excerpt)
| z | Area below z | Area between −z and +z |
|---|---|---|
| 0.5 | 0.6915 | 0.3829 |
| 1 | 0.8413 | 0.6827 |
| 1.28 | 0.8997 | 0.7995 |
| 1.5 | 0.9332 | 0.8664 |
| 1.645 | 0.9500 | 0.9000 |
| 1.96 | 0.9750 | 0.9500 |
| 2 | 0.9772 | 0.9545 |
| 2.326 | 0.9900 | 0.9800 |
| 2.576 | 0.9950 | 0.9900 |
| 3 | 0.9987 | 0.9973 |
The full z-table (−3.49 to 3.49) is in the template pack.
Sample vs population: which should I use?
| Situation | Use |
|---|---|
| Survey of 200 customers to learn about all customers | Sample |
| Heights of every player on one team, describing that team only | Population |
| Quality check of 30 parts from a production run | Sample |
| Your own monthly spending for the last 12 months, describing just those months | Population |
| Lab measurements repeated 5 times | Sample |
If in doubt in a statistics class, the sample version is usually expected; spreadsheet functions STDEV.S (sample) and STDEV.P (population) match the two options here.
Common mistakes
- Dividing by n instead of n − 1 for a sample (or the reverse) — check which your course or software expects.
- Forgetting to square the deviations, so they sum to zero.
- Taking the square root of the sum of squares before dividing.
- Rounding the mean too early, which makes every later step slightly wrong — keep full precision until the end.
- Reporting variance when the question asks for standard deviation, or the other way round.
- Mixing units, such as some heights in centimetres and some in inches.
Standard deviation vs other measures of spread
| Measure | What it shows | Sensitive to outliers? |
|---|---|---|
| Range | Maximum minus minimum | Very |
| Interquartile range | Spread of the middle 50% | No |
| Variance | Average squared deviation | Very |
| Standard deviation | Typical distance from the mean, in original units | Yes |
| Mean absolute deviation | Average absolute distance from the mean | Less than SD |
For skewed data or data with outliers, report the median and interquartile range alongside, or instead of, the mean and standard deviation.
Frequency tables
For grouped or repeated data, switch the format to “Value, frequency pairs” and enter each value with how many times it occurs — for example “3, 4” means four 3s. The calculator expands the list and applies the same formulas. For class intervals (such as 10–19), enter each class midpoint with its frequency to get the usual grouped-data approximation.
What’s in the template pack
- Excel standard deviation workbook with a step-by-step table and STDEV.S/STDEV.P checks
- Printable step-by-step worksheet with answer keys
- Full standard normal (z) table, −3.49 to 3.49
- Formula reference card for mean, variance, SD, z-scores and standard error
- Data collection sheet
The pack is a one-time download; the calculator is free.
Privacy
Your data is analysed in your browser and never uploaded.
Frequently asked questions
What is the difference between sample and population standard deviation?
The sample version divides by n − 1, the population version by n.
What does a high standard deviation mean?
Values are widely spread around the mean.
Can standard deviation be negative?
No — it is a square root, so it is zero or positive.
How is variance related to standard deviation?
Variance is the square of the standard deviation.
Which Excel function should I use?
STDEV.S for a sample, STDEV.P for a whole population.
Is my data uploaded?
No. Everything runs in your browser.
What is a z-score?
How many standard deviations a value lies above or below the mean.
Why divide by n − 1 for a sample?
A sample’s values sit closer to their own mean than to the population mean, so dividing by n would underestimate the spread; n − 1 corrects this.
What is a good standard deviation?
There is no universal “good” value — judge it relative to the mean and to what matters in your field.
May I print and share these worksheets with my class?
License: personal and classroom use. Teachers may print and photocopy these files for the students in their own classes, and share them in a password-protected class space (e.g. Google Classroom). Please do not resell, redistribute, or post the files on public websites. One purchase covers one teacher.